Tropical Weather
Page
last modified: June 5, 2025 at 04:36 PM EDT
Graphics update automatically -- check image timestamps for most recent updates/valid periods.
| Eastern Time 12-Hour | Eastern Time 24-Hour | UTC / Z / Greenwich |
|---|---|---|
| -- | -- | -- |
2-Day Tropical
Atlantic Outlook
7-Day Tropical Atlantic
Outlook

Atlantic Sea Surface
Temperatures 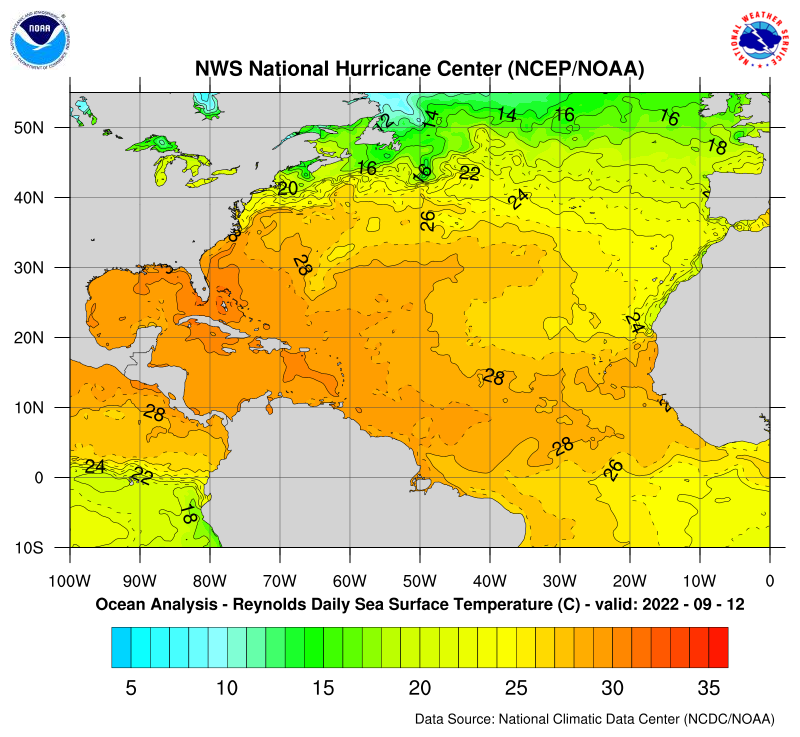
Top of Page
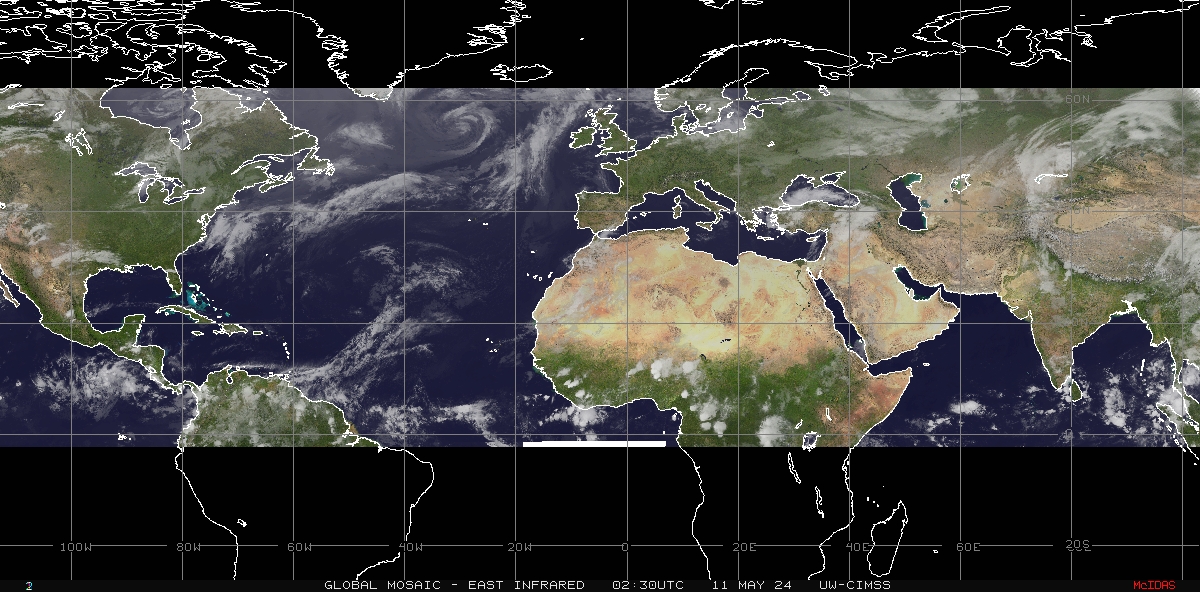
Global Sea Surface
Temperatures
Top of Page


Top of Page
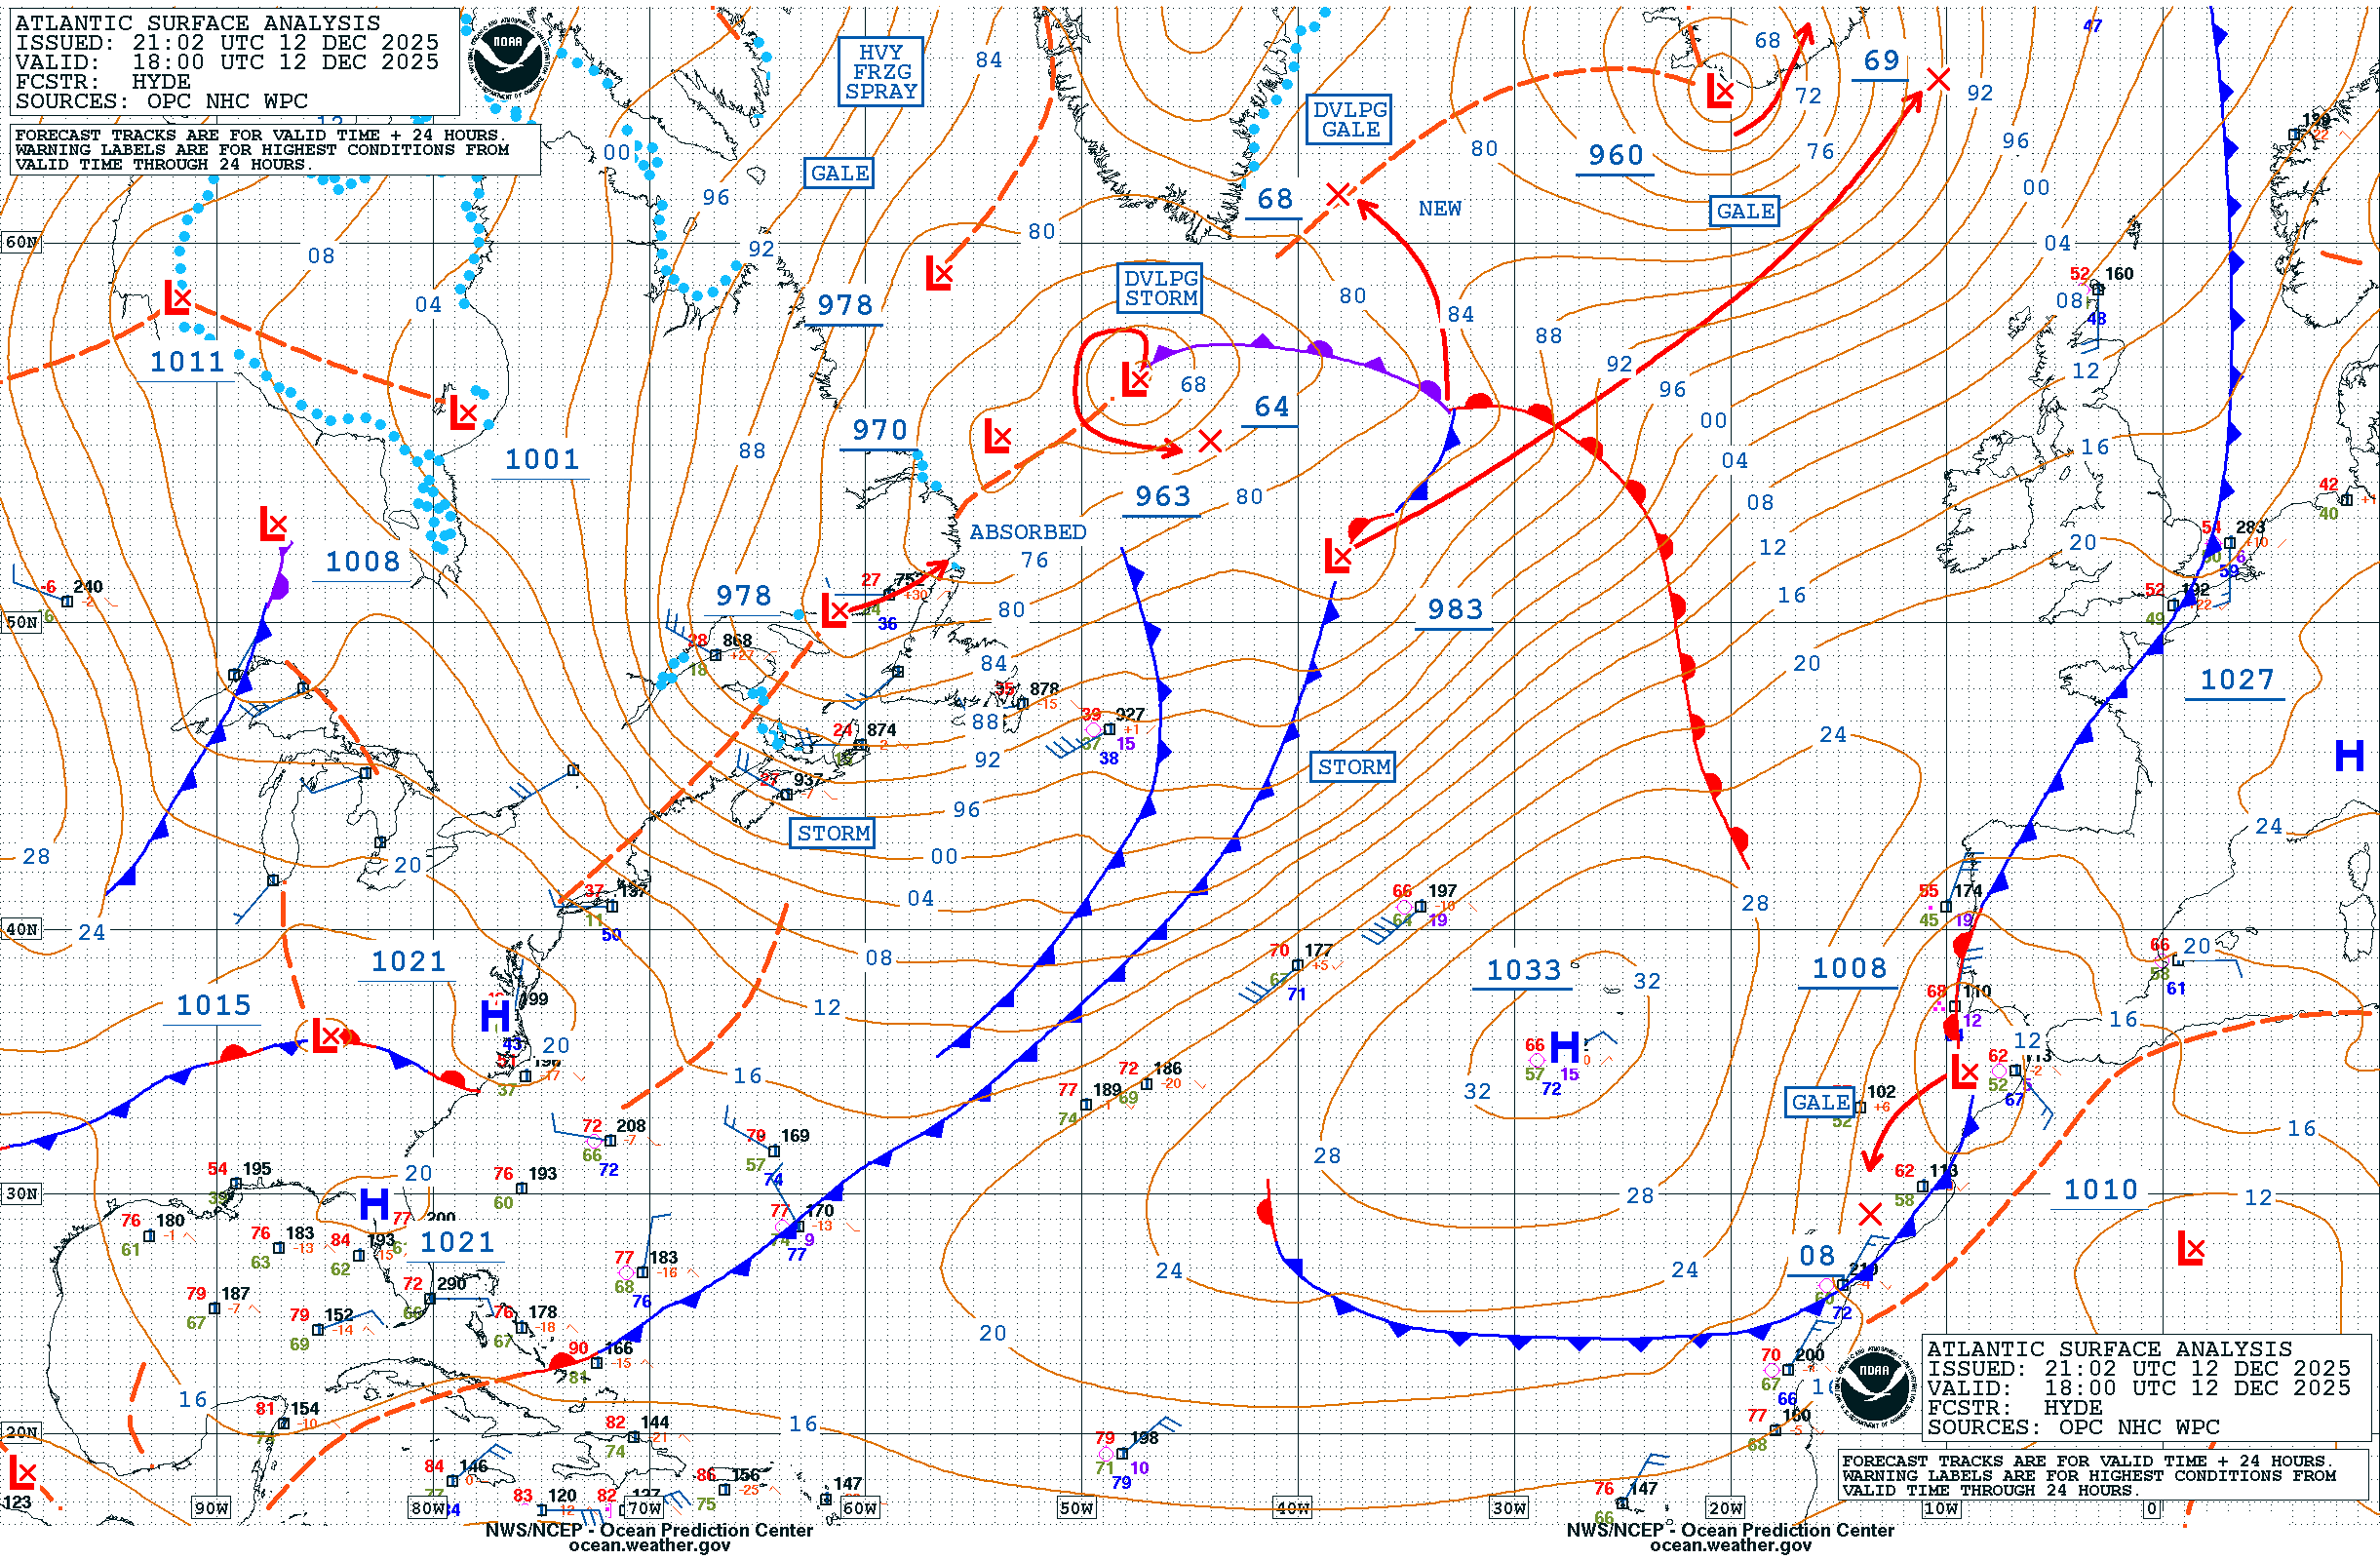
US Atlantic
Coast Infrared Satellite

US Atlantic
Coast True Color Satellite

US Atlantic
Coast Mid-level Water Vapor Satellite

Top of Page

Gulf of Mexico
True Color Satellite


Top of Page

Caribbean True Color
Satellite

Caribbean Mid-level Water
Vapor Satellite

Top of Page
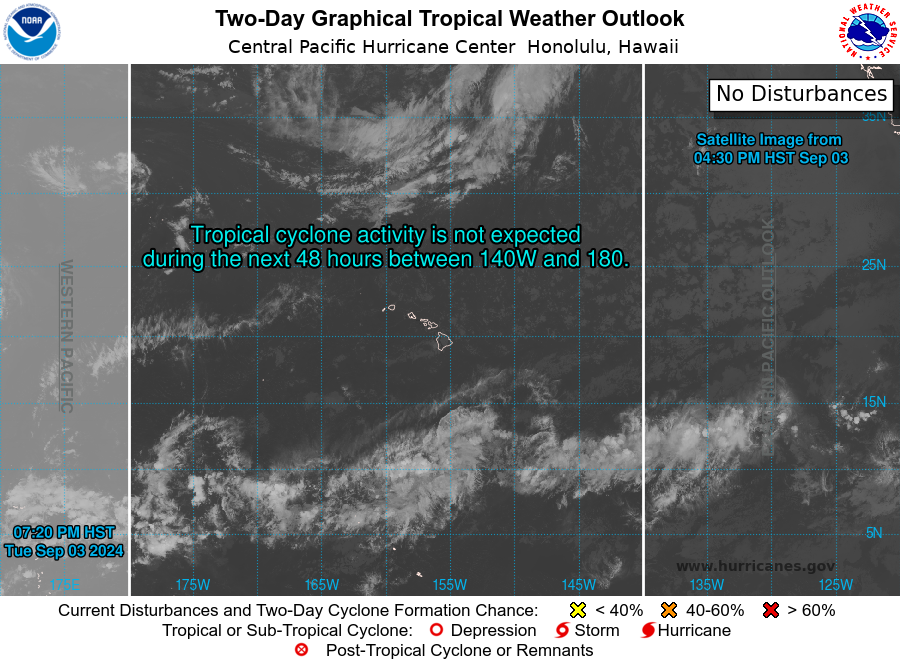
Eastern
Pacific 2-Day Tropical Weather Outlook
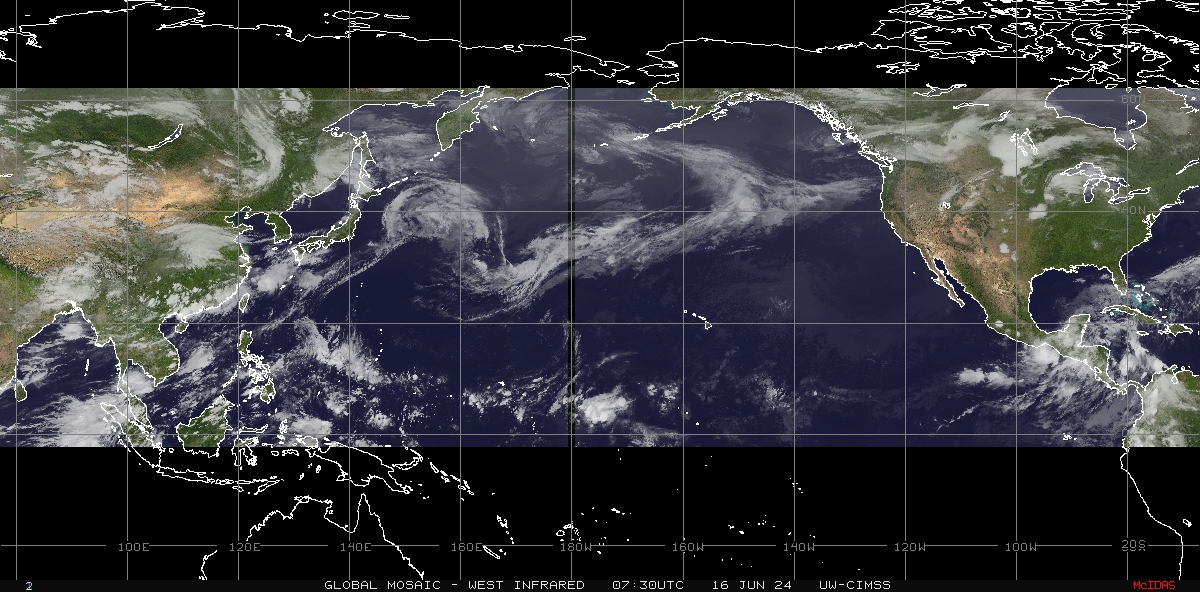
Pacific Infrared Satellite
Mosaic
Eastern Pacific 7-Day
Tropical Weather Outlook

Top of Page

Eastern East Pacific True
Color Satellite

Day 3 Severe Thunderstorm
Outlook

Top of Page
Central Pacific 7-Day
Tropical Outlook
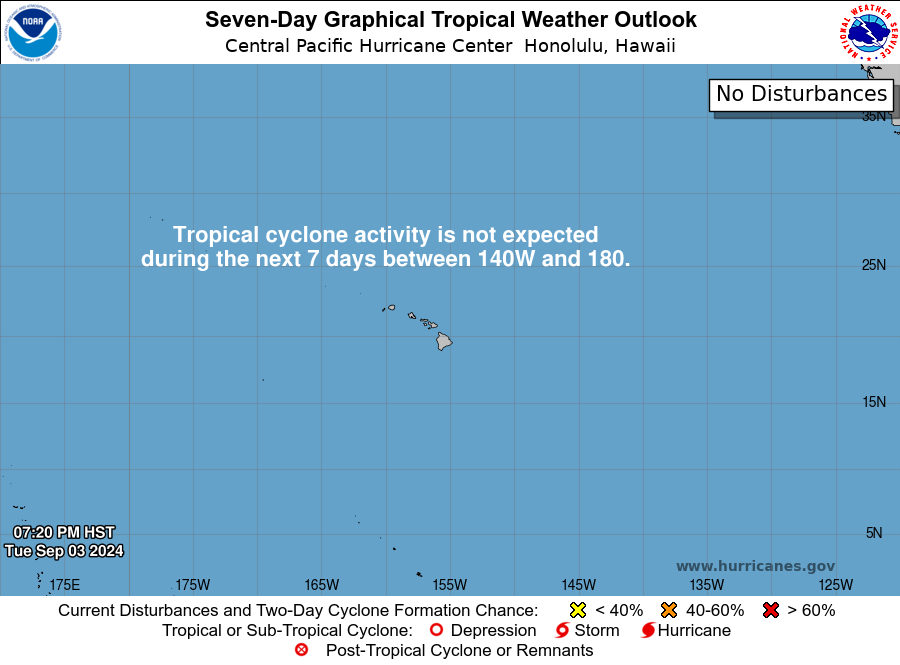
Tropical Weather Outlook
Other Regions

Top of Page