Space Weather


Click maps and charts for larger versions, etc. Most graphics update automatically--check timestamps for currency. During updates, maintenance, network outages, etc., graphics may be temporarily unavailable. Graphic sources include NOAA, NWS, University of Wisconsin, Weather Underground, and various other organizations. All products produced by the US government or affiliated organizations are public domain unless otherwise labeled.

Note: For US Eastern Time on maps and charts, subtract 4 hours (Daylight Saving Time) or 5 hours (Standard Time) from UTC / Z timestamp on the maps and charts. UTC / Z / GMT = Coordinated Universal Time / Zulu Time / Greenwich Mean Time -- Time is based on 0° longitude running through the Royal Observatory in Greenwich, London, UK. It is the same all year round and is not affected by Daylight Saving Time (aka Summer Time) clock changes. Using UTC allows weather services and others to avoid time zone conversions. Visit timeanddate.com for more time zone conversion information and additional time-related data.

For more information regarding solar activity, visit the Space Weather Prediction Center at https://www.swpc.noaa.gov/. See also the current NOAA Space Weather Forecast Discussion

More solar activity information can also be found at Solar Ham.com: https://www.solarham.net/

Caution: Enjoy the solar images on this and other web pages. Never attempt to look directly at the sun--permanent eye damage can result from UV radiation.


Current Time US Eastern and UTC / Z
ET 12-Hour ET 24-Hour UTC / Z


Today's SunToday's Sun
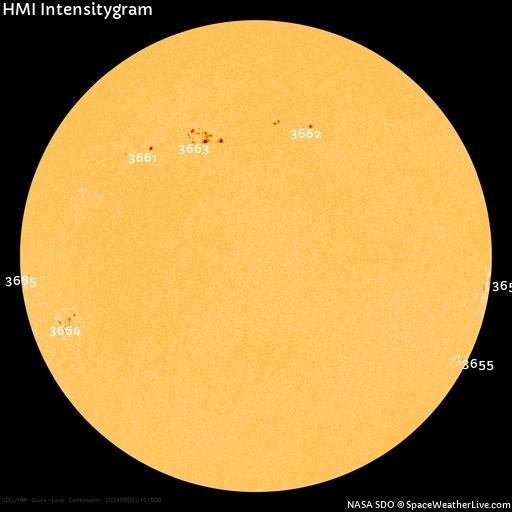
Visit NASA's Solar Dynamics Observatory (SDO) for more images and information.
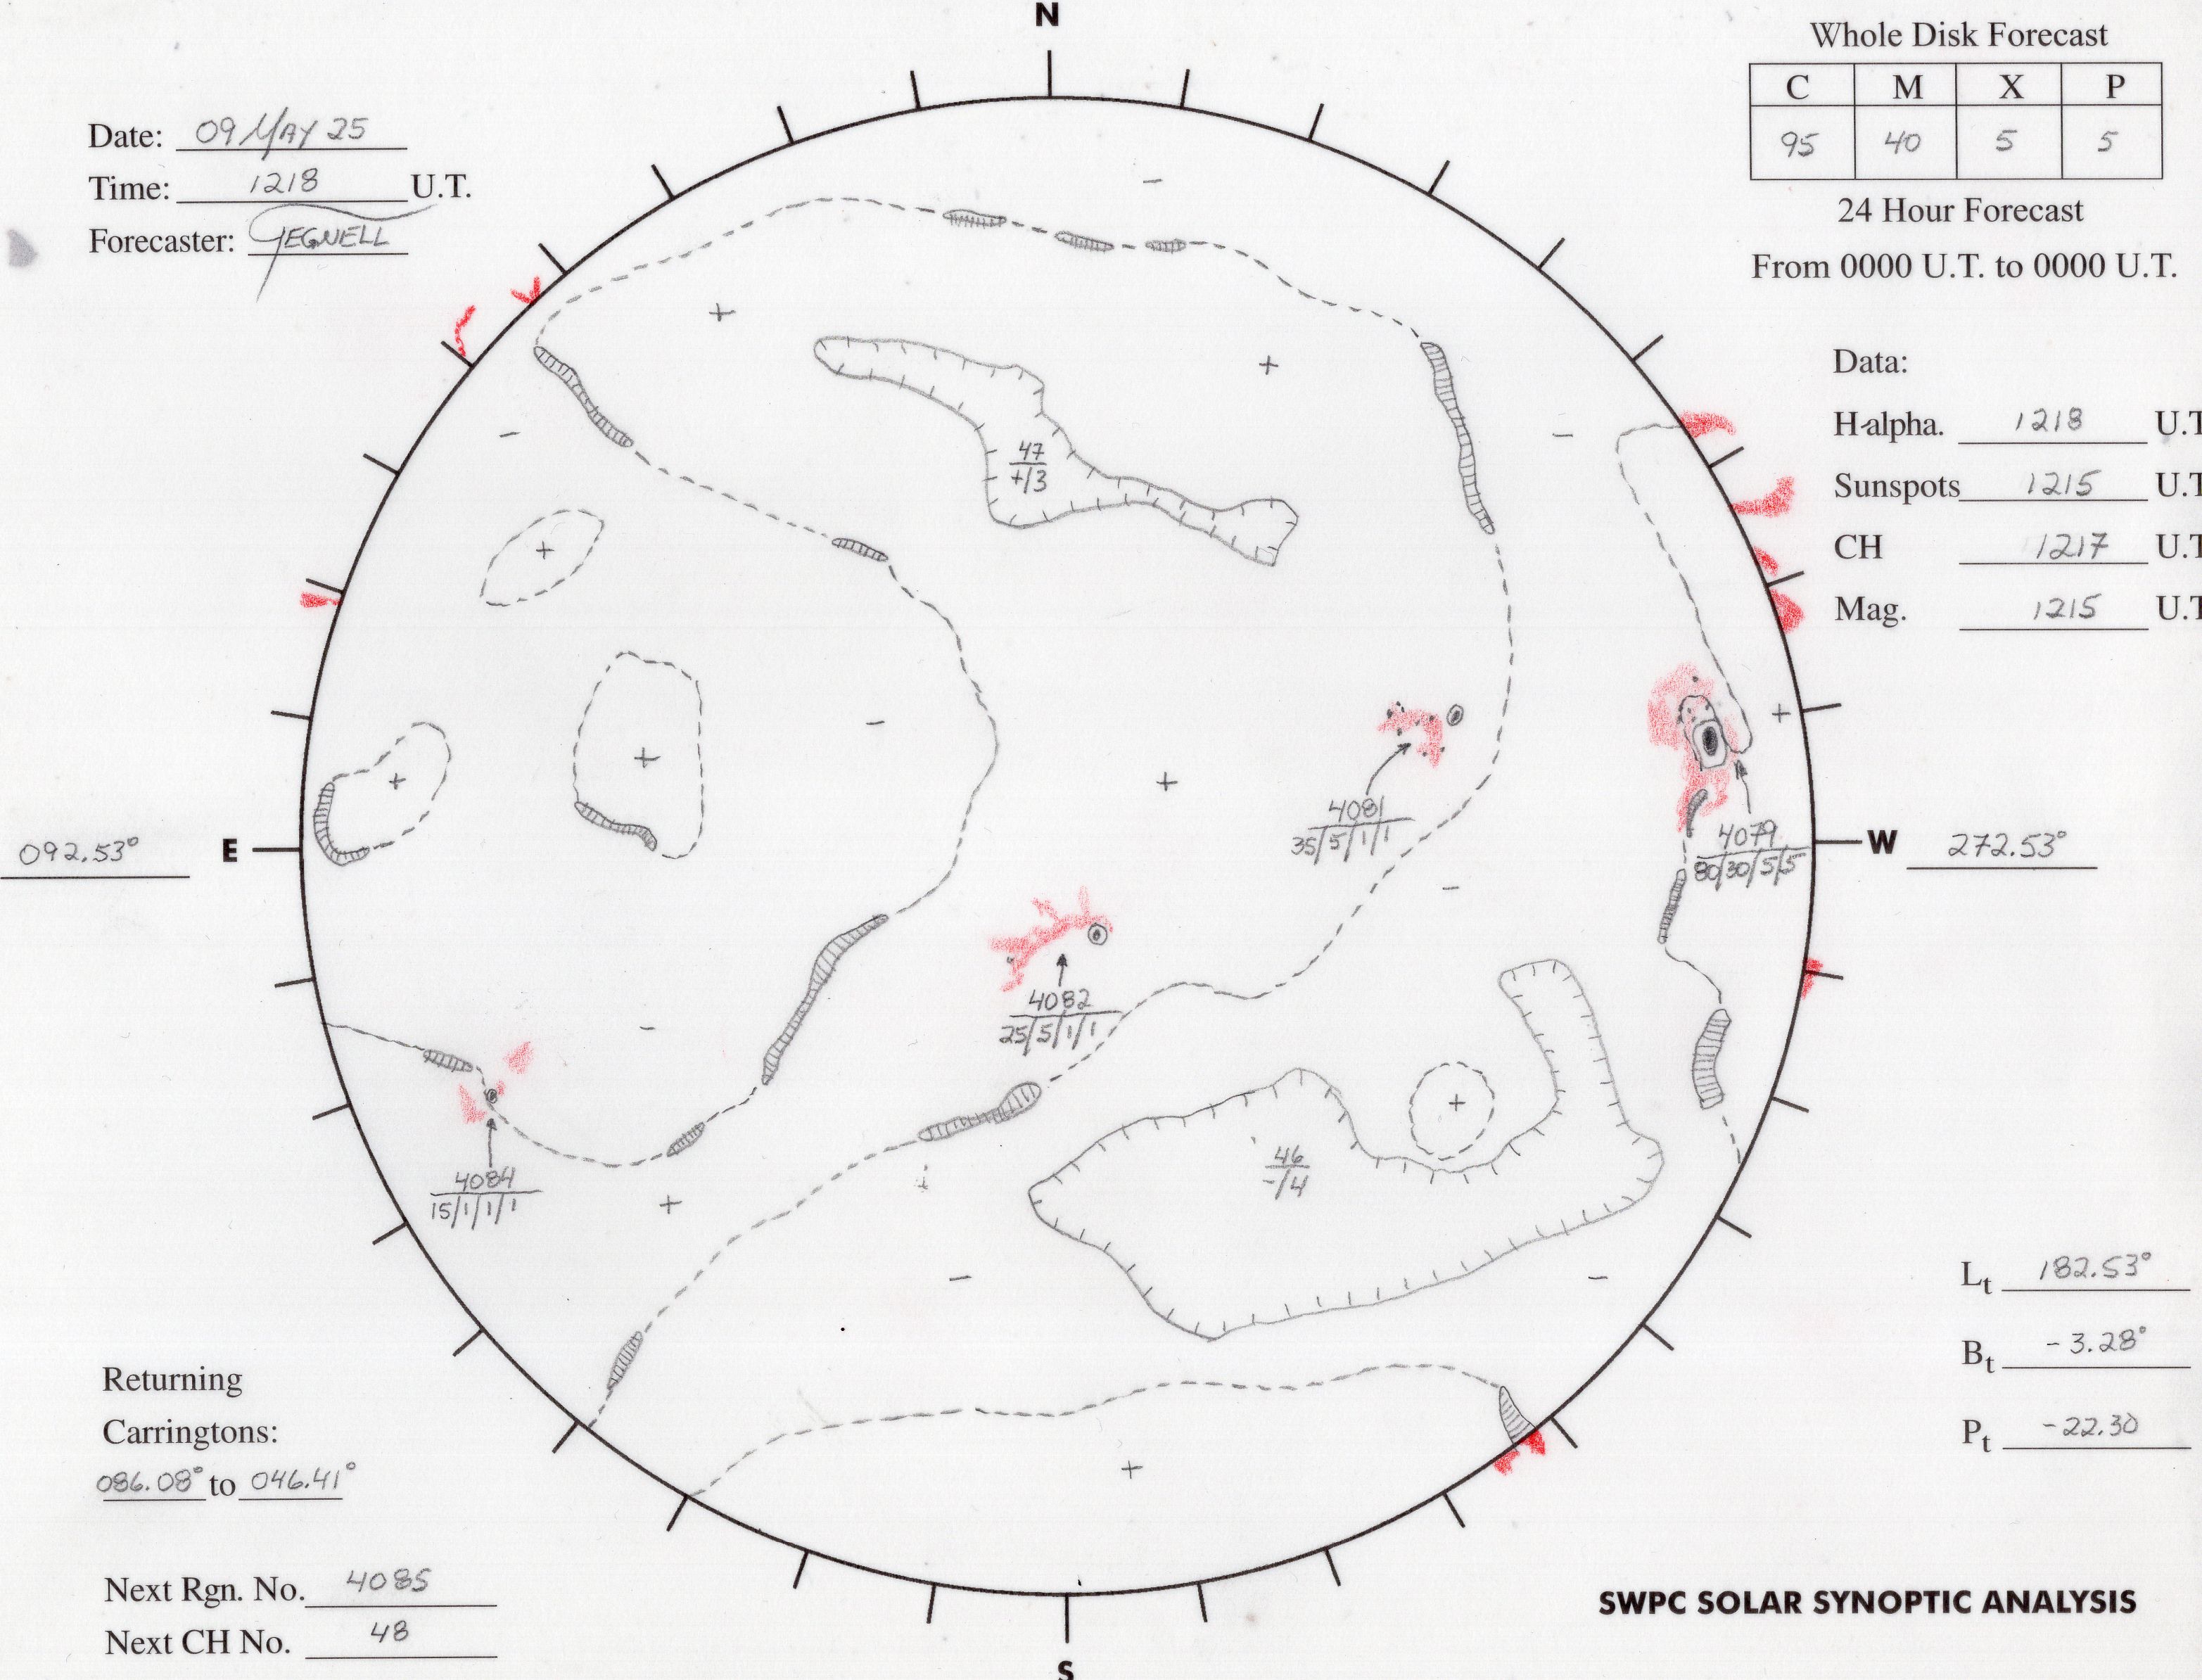
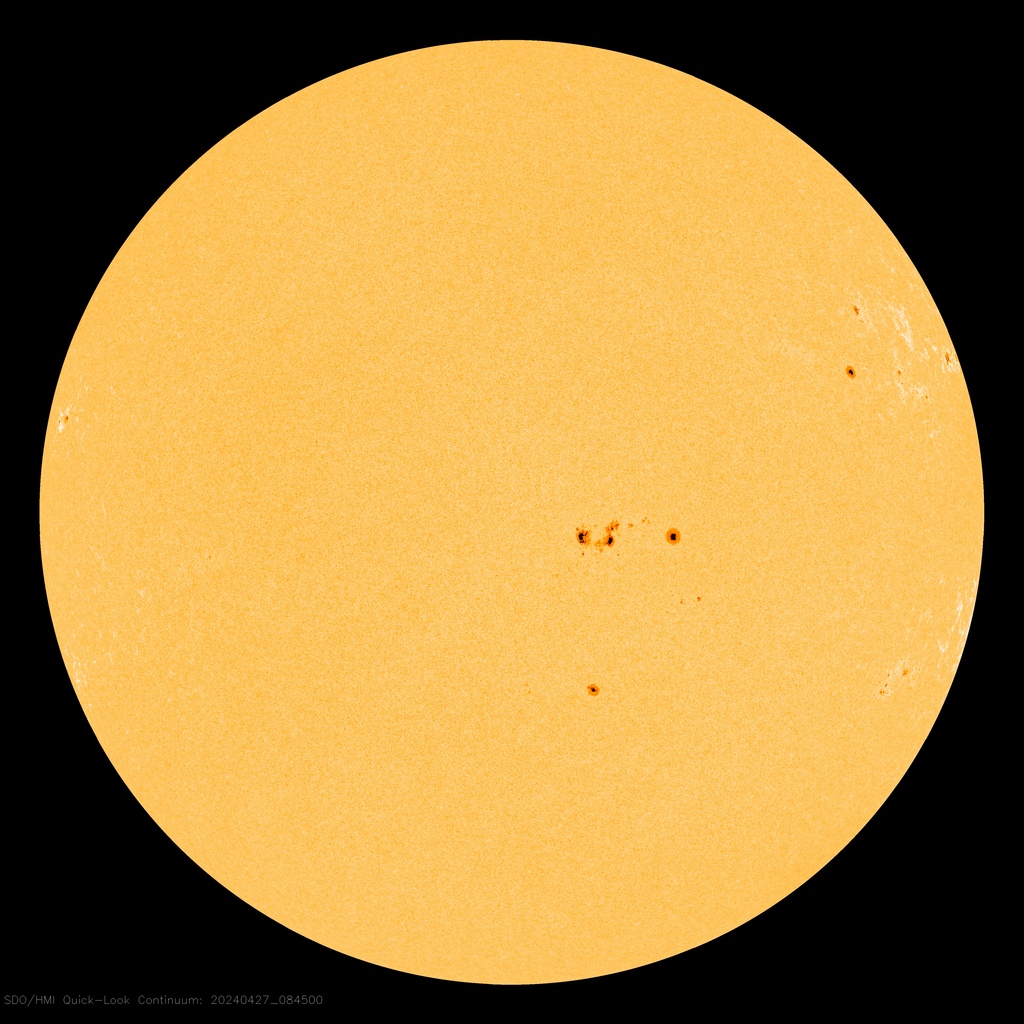
Sunspots are areas that appear dark on the surface of the Sun. They appear dark because they are cooler than other parts of the Sun’s surface. Solar flares are a sudden explosion of energy caused by tangling, crossing or reorganizing of magnetic field lines near sunspots. Numbers are the current
NOAA/SWPC sunspot regions.
Coronal Holes Coronal Holes
View 48-hour video. Coronal holes are the primary solar wind source.
Filaments and prominences
View 48-hour video


Top of Page


Planetary K IndexPlanetary K-Index
The K-index, and by extension the Planetary K-index, are used to characterize the magnitude of geomagnetic storms. Kp is an excellent indicator of disturbances in the Earth's magnetic field and is used by SWPC to decide whether geomagnetic alerts and warnings need to be issued for users who are affected by these disturbances.
Click for a tutorial.
SOHO LASCO C2 Coronagraph Coronal Holes
The LASCO C2 coronagraph monitors the corona and can detect the emergence of coronal mass ejections.. White circle indicates the occluded solar disk.
SOHO LASCO C3 Coronagraph
The Large Angle and Spectrometric Coronagraph (LASCO) C3 coronagraph monitors the inner heliosphere from from and can track the propagation of coronal mass ejections previously seen by LASCO C2. White cirle denotes the occluded solar disk.


Top of Page


Solar Radiation Activity
Visit NOAA Space Weather Scales for an explanation of the intensity scales used in the graphs.
Sunspot Regions ChartDaily Sunspot Analysis
Click image for more information (on website click "Details" for explanation of chart markings).
Aurora Forecast
Aurora Forecast
The Aurora Forecast Model shows the intensity and location of predicted auroras.


Top of Page