Regional Maps & Charts
Graphics update automatically -- check image timestamps for most recent updates/valid periods.
☰ Menu
Home
Severe Weather Outlook
Satellite
Temperature
Hazards
Precipitation
Area Rivers
Coastal Conditions
Eastern Time 12-Hour
Eastern Time 24-Hour
UTC / Z / Greenwich
--
--
--
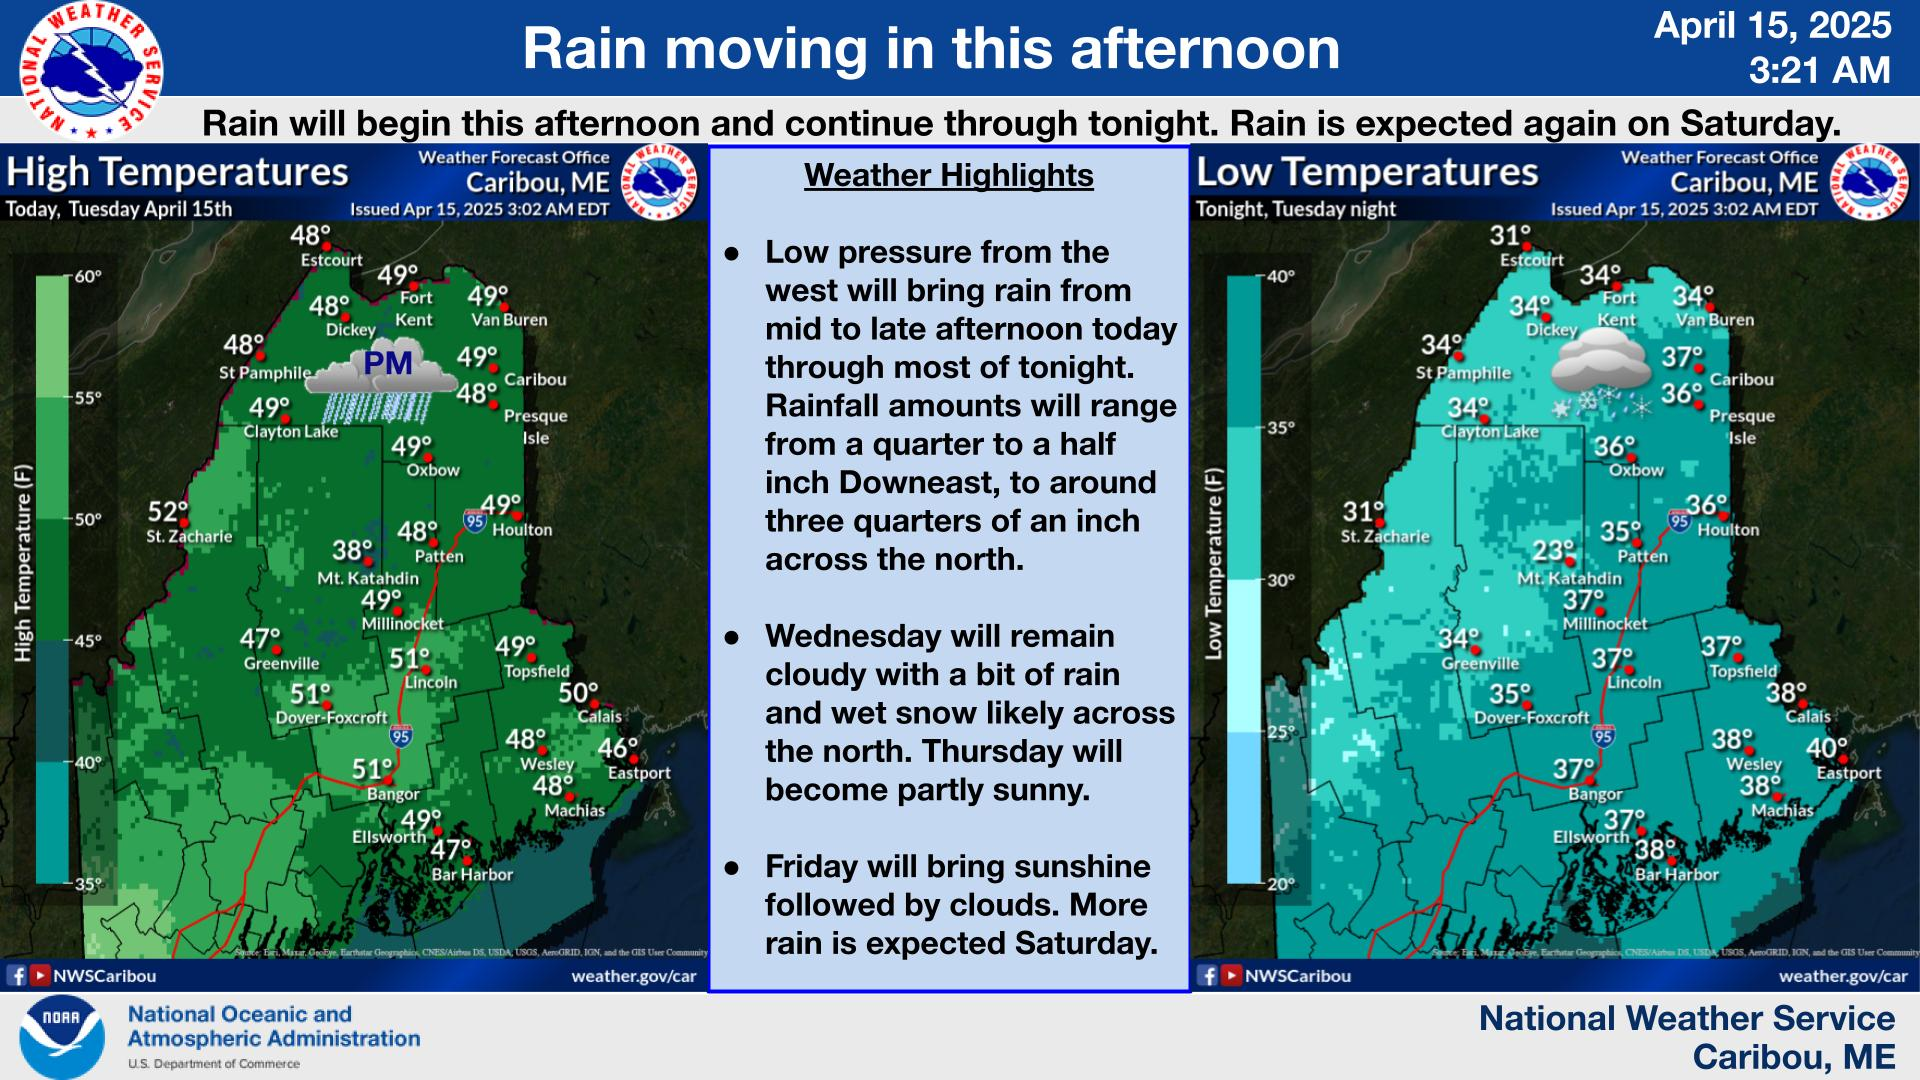
NE Weather Chart
NE Radar
NWS Caribou Weather Briefing
Top of Page
NE Geocolor Satellite
NE Infrared Satellite
NE Water Vapor Satellite
Top of Page
Today's Highs
Tonight's Lows
Today's Minimum Relative Humidity
Top of Page
Tomorrow's Highs
Tomorrow Night's Lows
Tomorrow's Minimum Relative Humidity
Top of Page
Today's Heat Risk
Today's Hazards
Tonight's Hazards
Top of Page
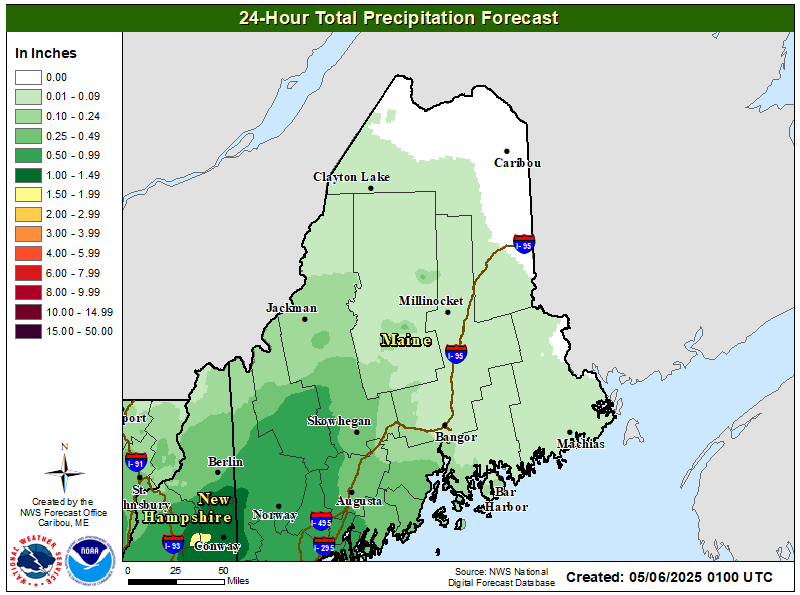
Today's Forecast Precipitation
Tonight's Forecast Precipitation
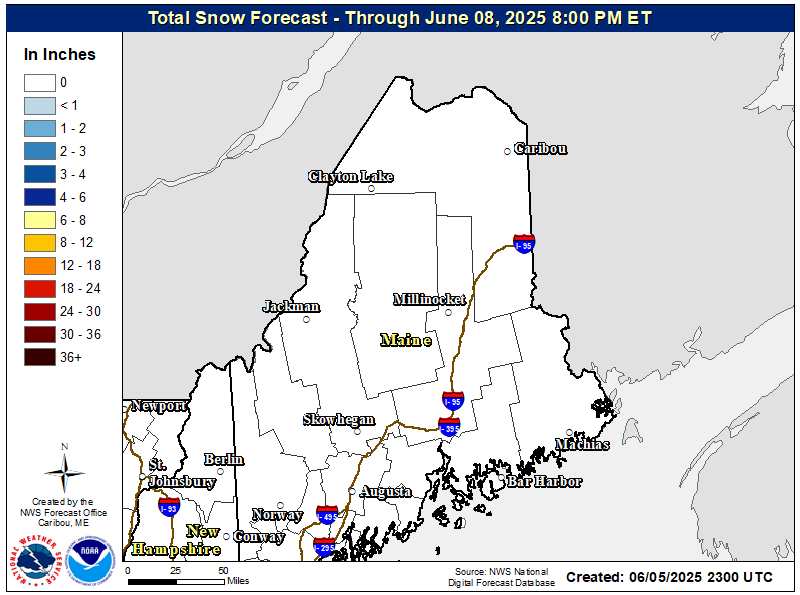
Today's Snowfall Outlook
Today's Ice Accumulation Outlook
Tonight's Ice Accumulation Outlook
Today's Snowfall Outlook
Top of Page
Tomorrow's Precipitation Outlook
Tomorrow Night's Precipitation Outlook
Tomorrow Night's Snowfall Outlook
Top of Page
Today's Wind Gust Outlook
Tonight's Wind Gust Outlook
Today's "Feel's Like" Temperature
Top of Page
Day 1 Severe Weather Outlook
Day 2 Severe Weather Outlook
Day 3 Severe Weather Outlook
Top of Page
Maine Drought Monitor
Northeast River Forecast Center Briefing
Saint John River at Fort Kent
Top of Page
Fish River at Fort Kent
Saint John River at Dickey
Allagash River above Allagash
Top of Page
Today's Wave Heights (Gulf of Maine)
Tonight's Wave Heights (Gulf of Maine)
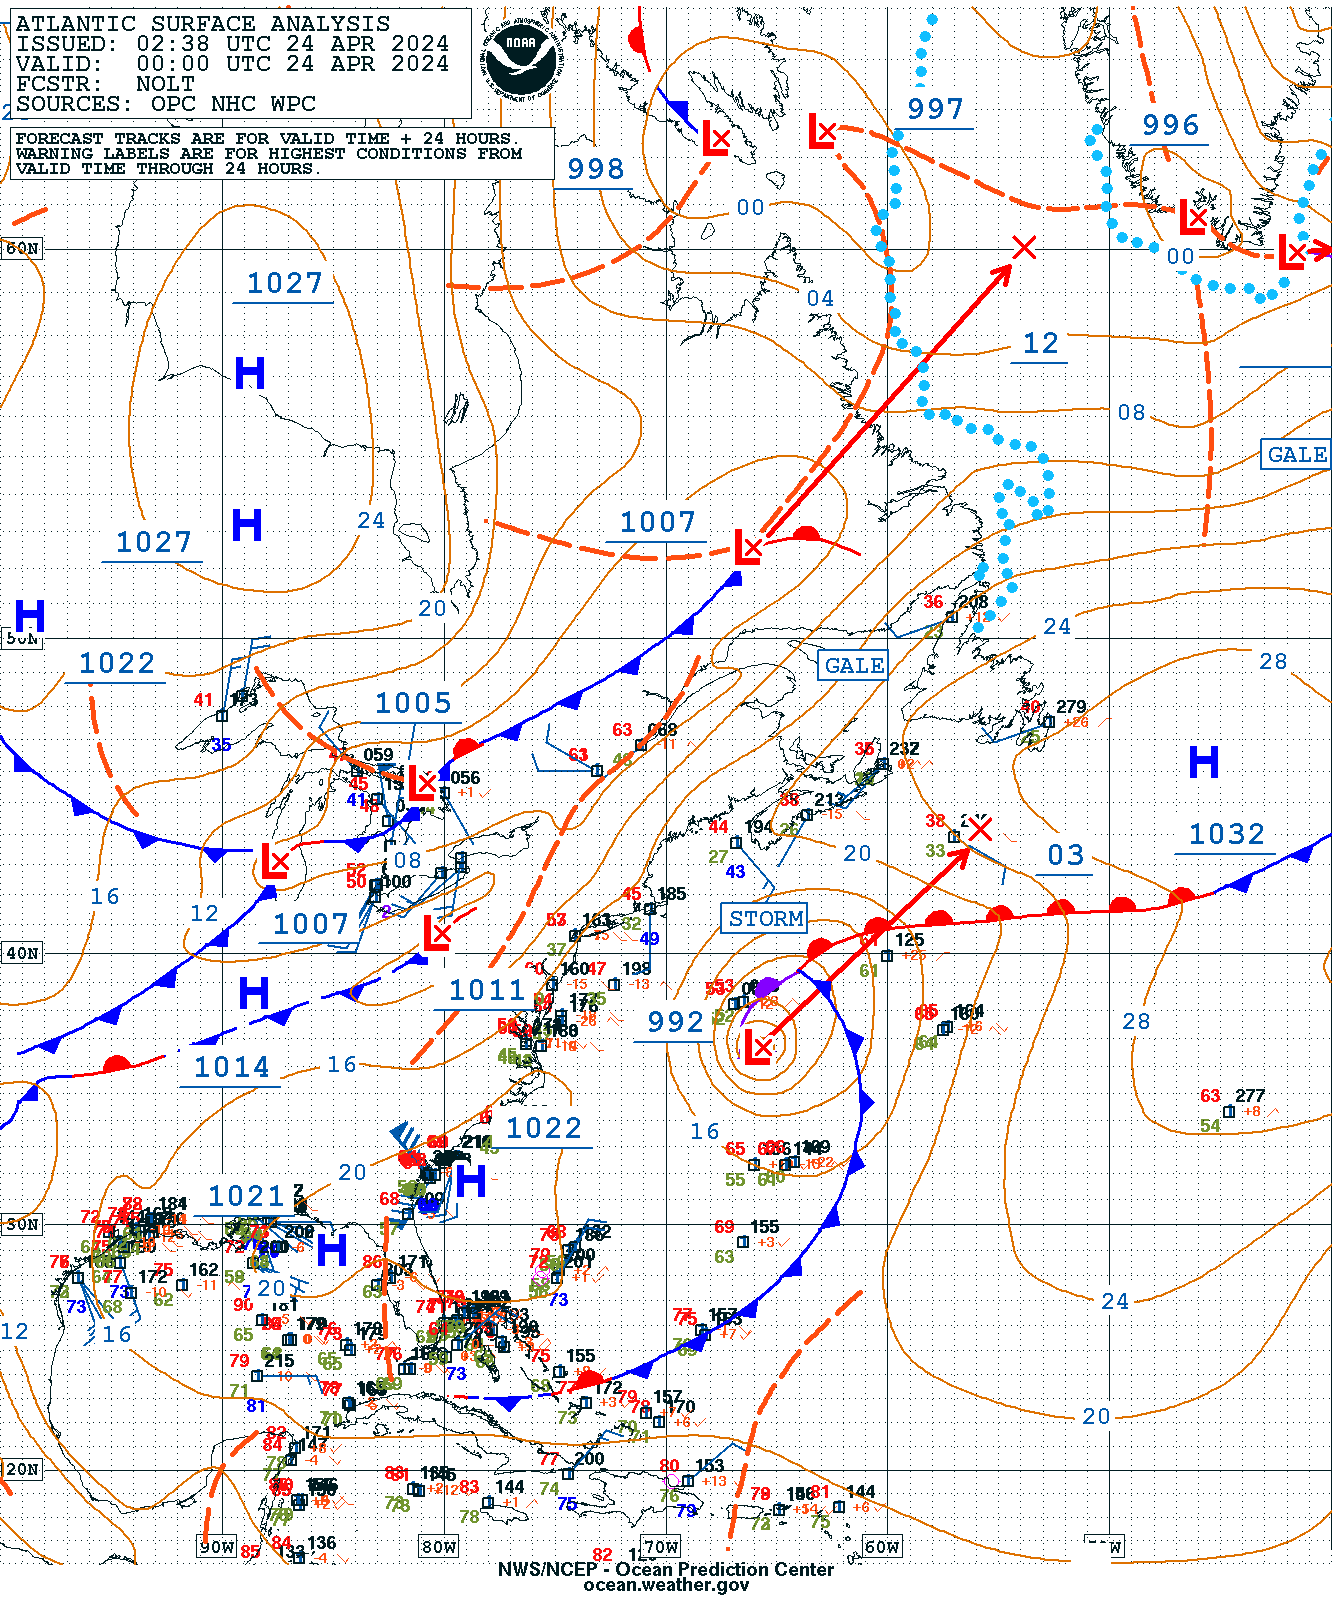
Western Atlantic Weather Chart
Top of Page


