National Maps & Charts
Graphics update automatically -- check image timestamps for most recent updates/valid periods.
Home
Satellite
Severe Weather
Temperature
Precipitation
Fire Weather
Trends
Eastern Time 12-Hour
Eastern Time 24-Hour
UTC / Z / Greenwich
--
--
--
National Weather Map
National Watches and Warnings
National Radar
Top of Page
National True Color Satellite
National Infrared Satellite
National Water Vapor Satellite
Top of Page
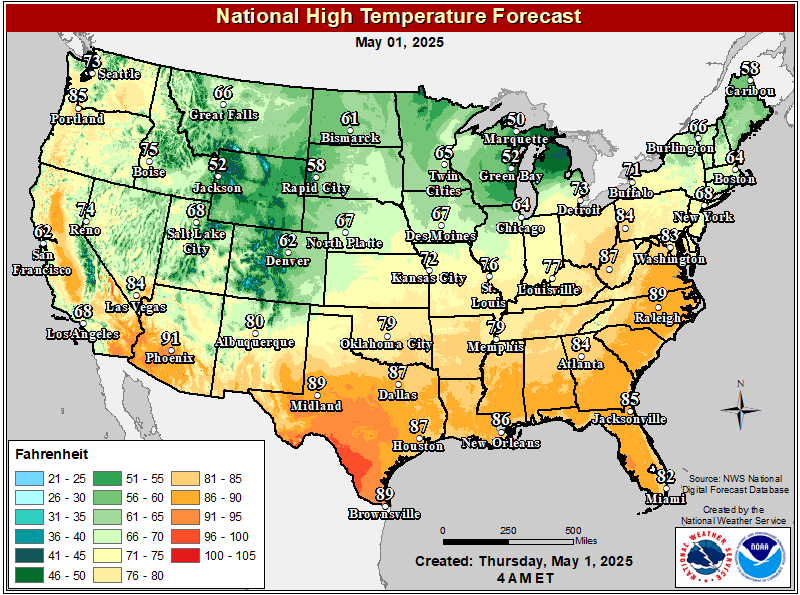
Today's Highs
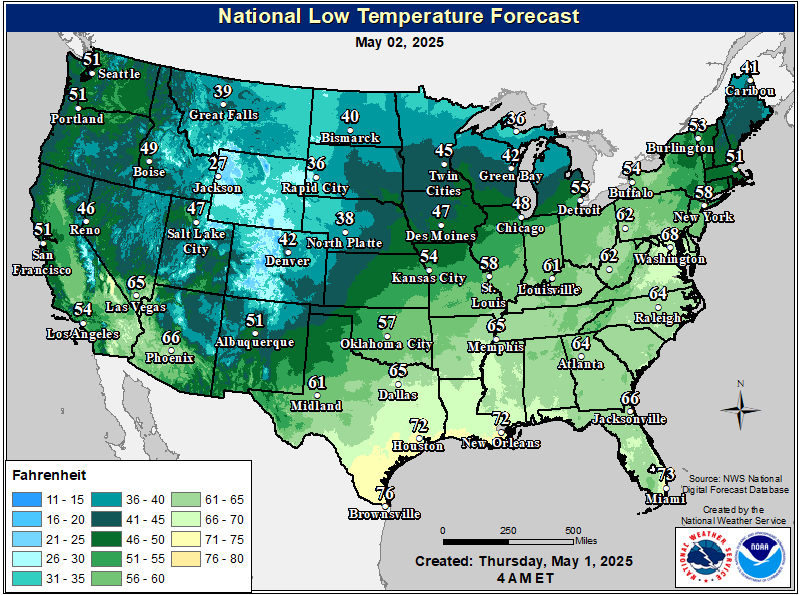
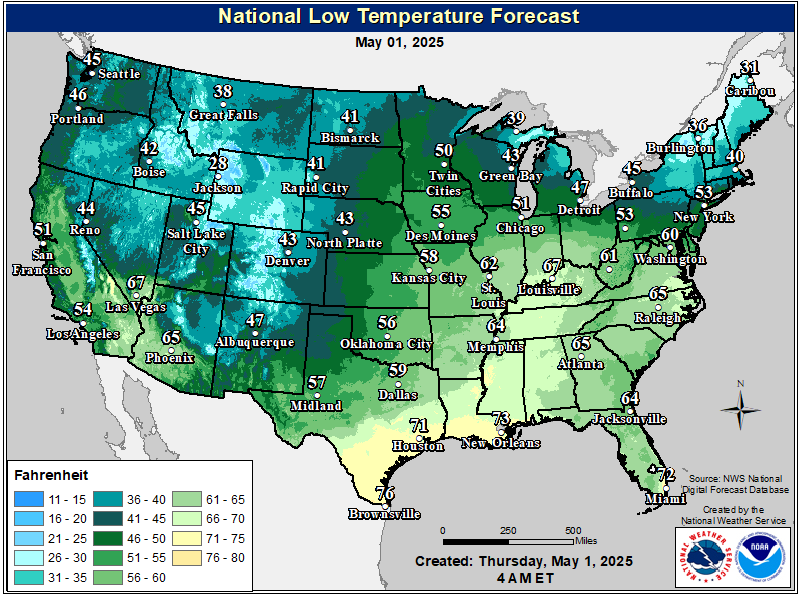
Tonight's Lows
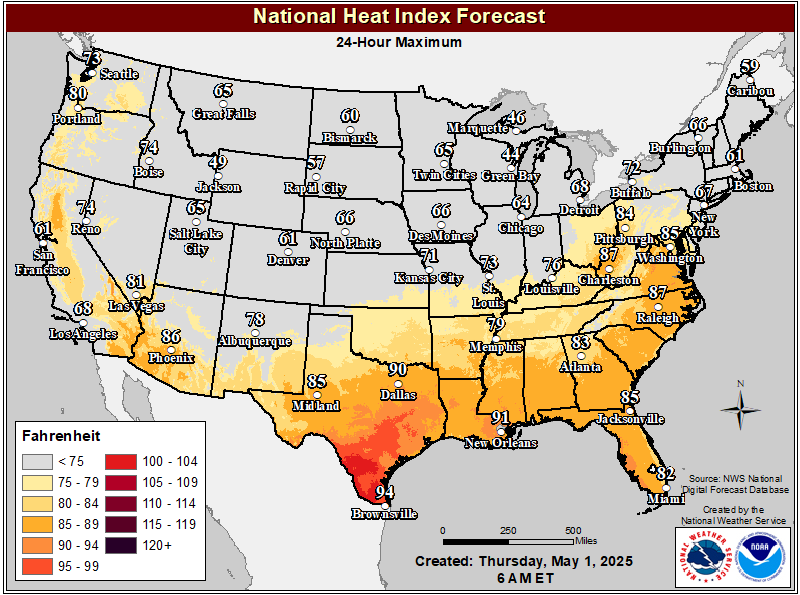
24-Hour Heat Index
Top of Page
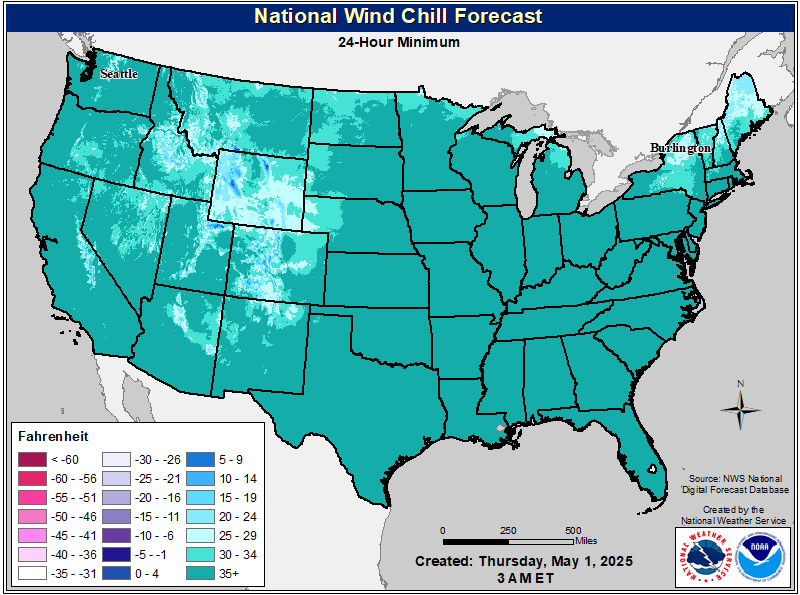
24-Hour Wind Chill
Tomorrow's Highs
Tomorrow Night's Lows
Top of Page
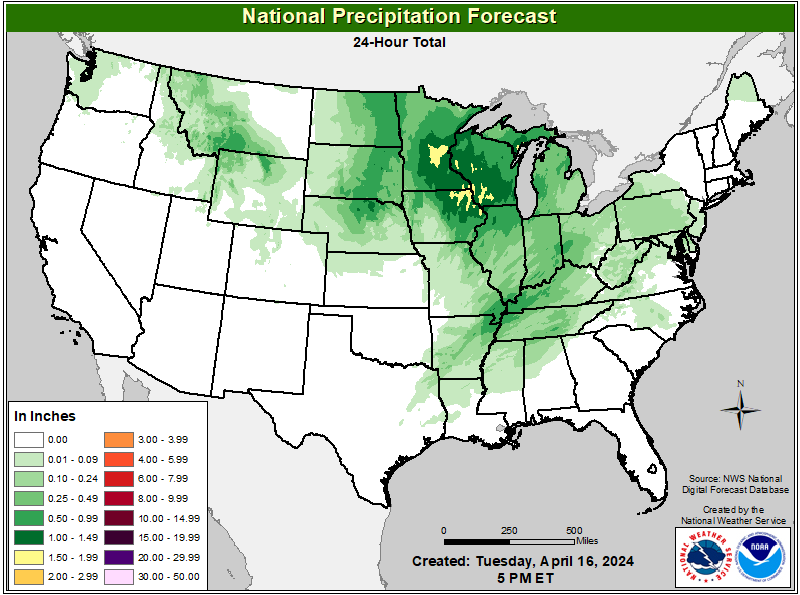
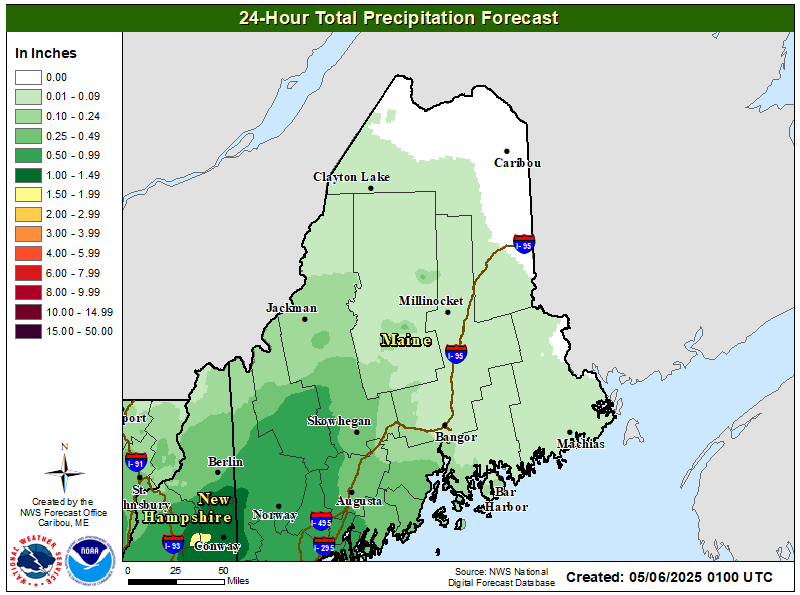
24-Hour Forecast Precipitation
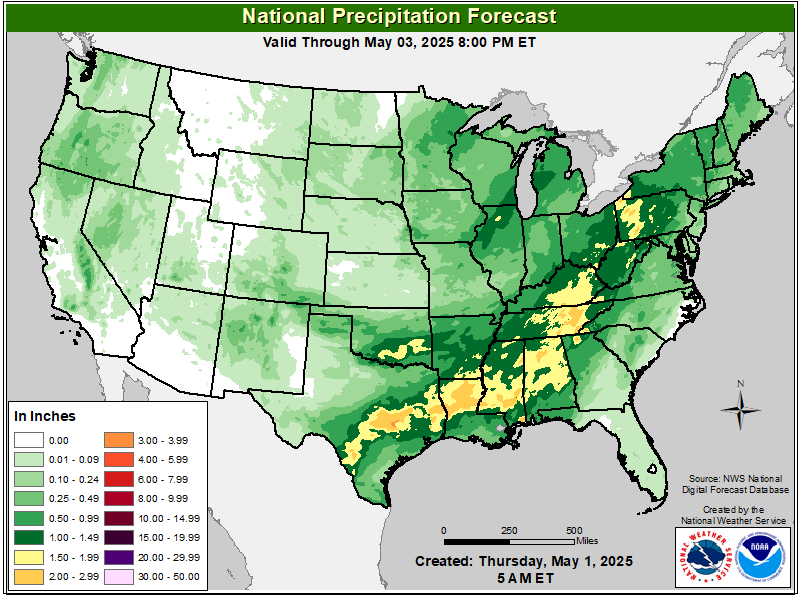
3-Day Forecast Precipitation
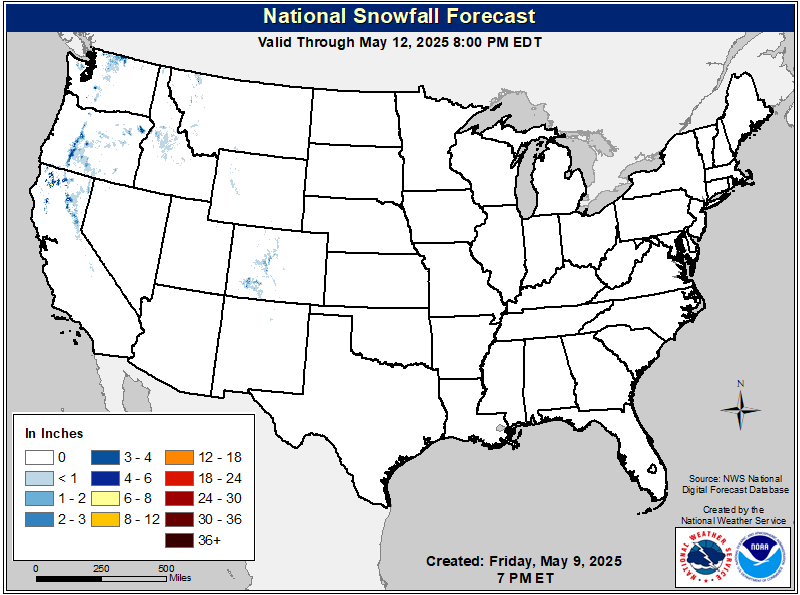
3-Day Snowfall Outlook
Top of Page
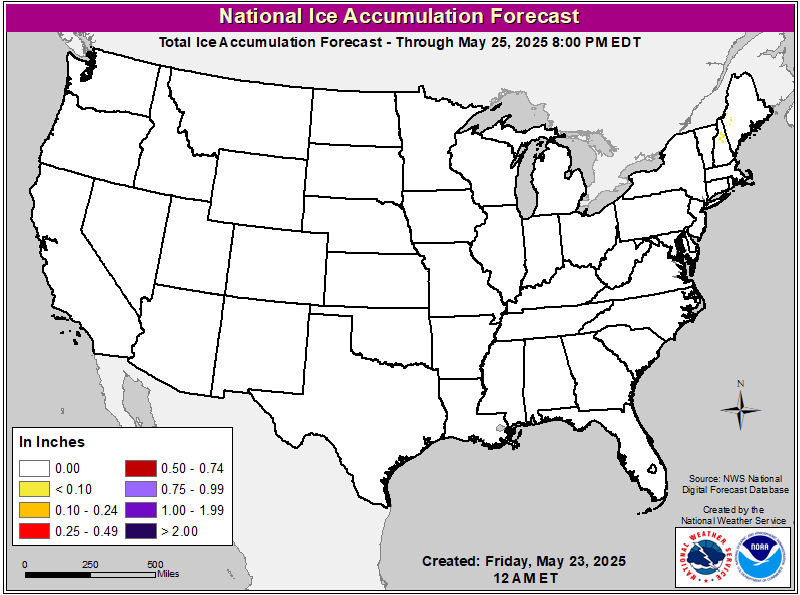
3-Day Ice Accumulation Outlook
7-Day Precipitation Trend
30 Day Precipitation Trend
Top of Page
Day 1 Excessive Rainfall Outlook
Day 1 Forecast Precipitation Totals
Day 7 Forecast Precipitation Totals
Top of Page
Day 1 Severe Thunderstorm Outlook
Day 2 Severe Thunderstorm Outlook
Day 3 Severe Thunderstorm Outlook
Top of Page
SPC Mesoscale Discussions
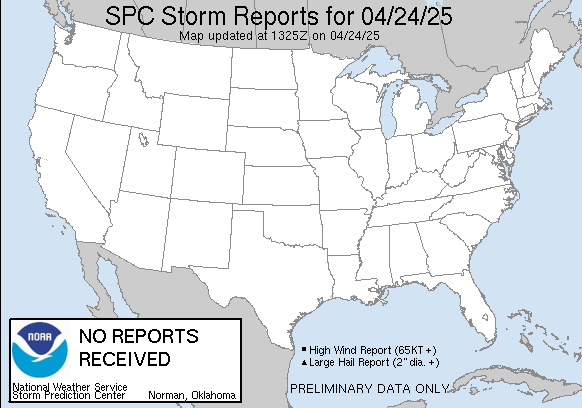
Today's SPC Storm Reports
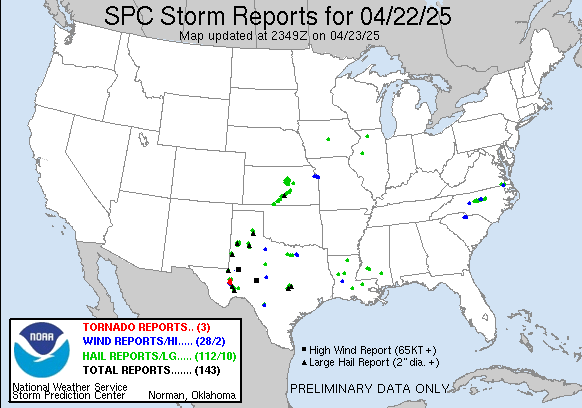
Yesterday's SPC Storm Reports
Top of Page
Monthly Drought Outlook
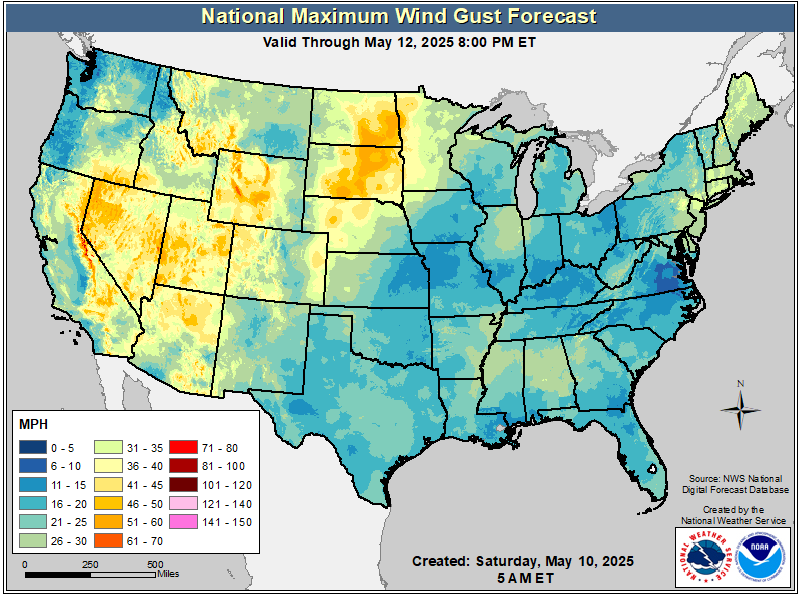
3-Day Wind Gust Outlook
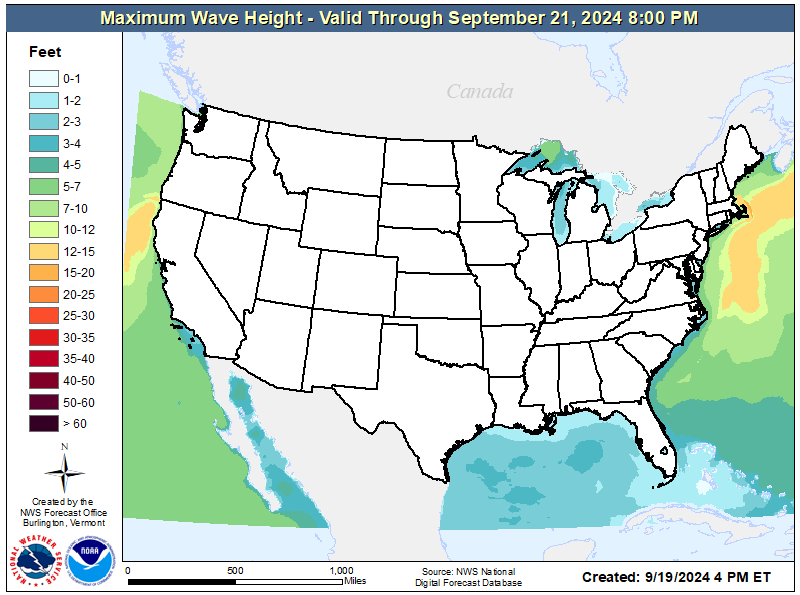
3-Day Maximum Wave Height
Top of Page
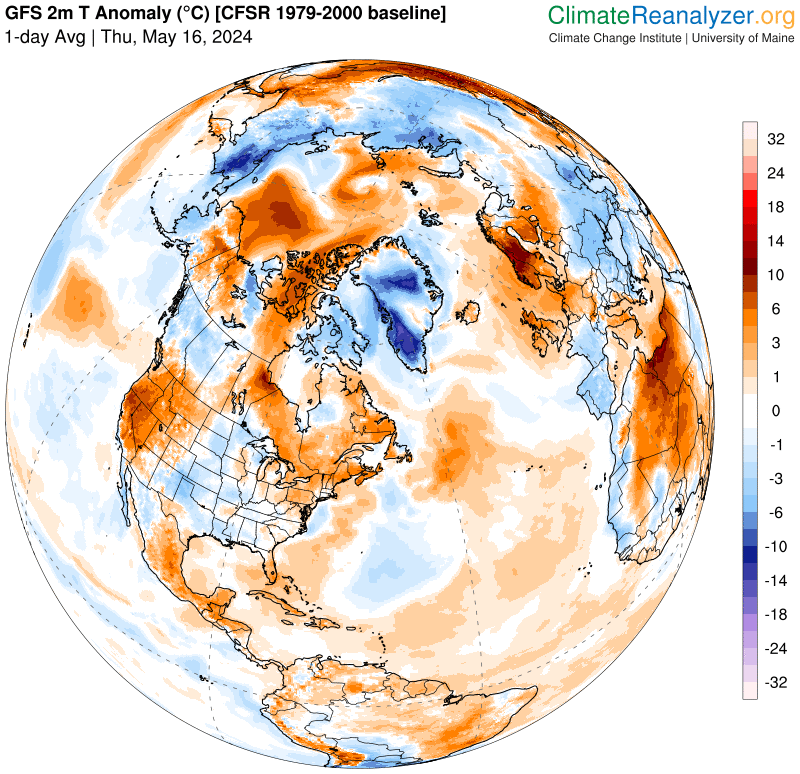
Current Temperature Anomaly
7-Day Temperature Trend
30-Day Temperature Trend
Top of Page
Day 1 Fire Weather Outlook
Day 2 Fire Weather Outlook
Day 3-8 Day Fire Weather Outlook


